How to graph trigonometric functions?
Graphing the trigonometric functions can be a bit tricky especially if you are going to be doing this by hand. I'm going to be showing you a good starting point of how to impose any given trigonometric function on an x and y plane.
Before you start getting your graphing paper out you are going to have to understand a couple of ideas first. Do you know the transformations that are happening to the base function? How are those changes affecting the given graph?
Here is a quick review of the basic transformations that a graph can go through.
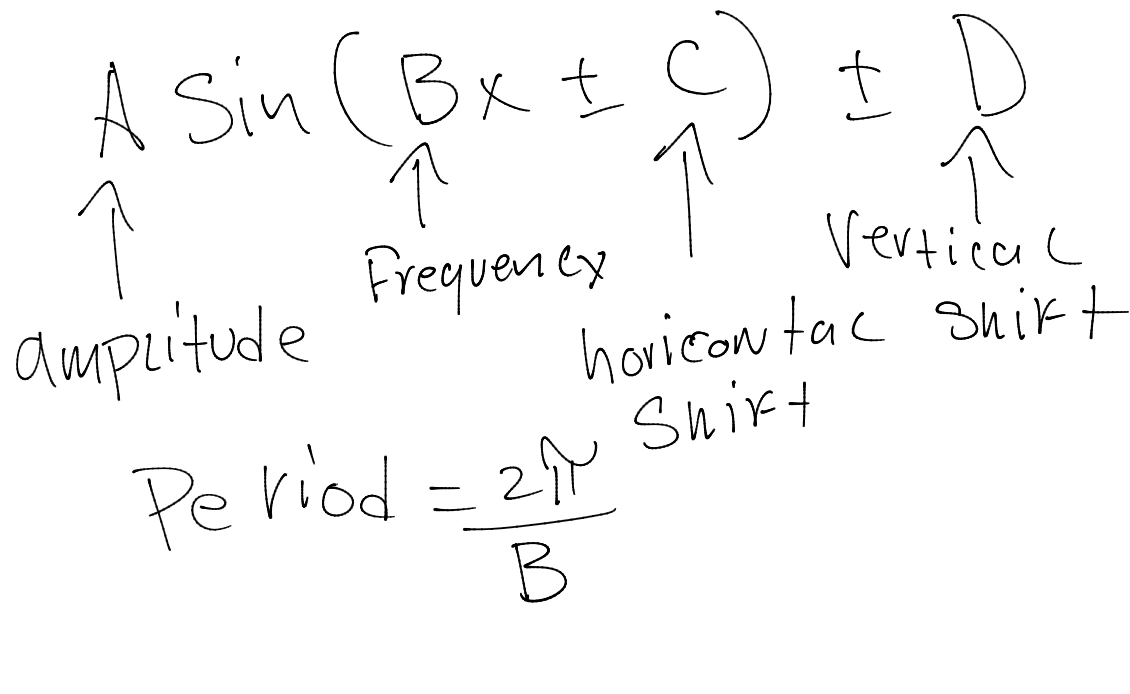
1.How to find the amplitude of a trigonometric function?
2.How to find the vertical shift of a trigonometric function?
3.How do you find the frequency of a trigonometric function?
4.How do you find the period of a trigonometric function?
5.How do you find the phase shift of a trigonometric function?
If you break up the general form into smaller parts you will be left with the following review of graphing a function.
You can now use this understanding of the graph and some key points to graph any of the trigonometric functions.