How to graph Polar Equations?
Start with a graph that has a radius of $3$ you know how this graph looks like it's just a circle with a radius of $3$ units that repeats over and over again in circular motion.
Graph of $r=3$
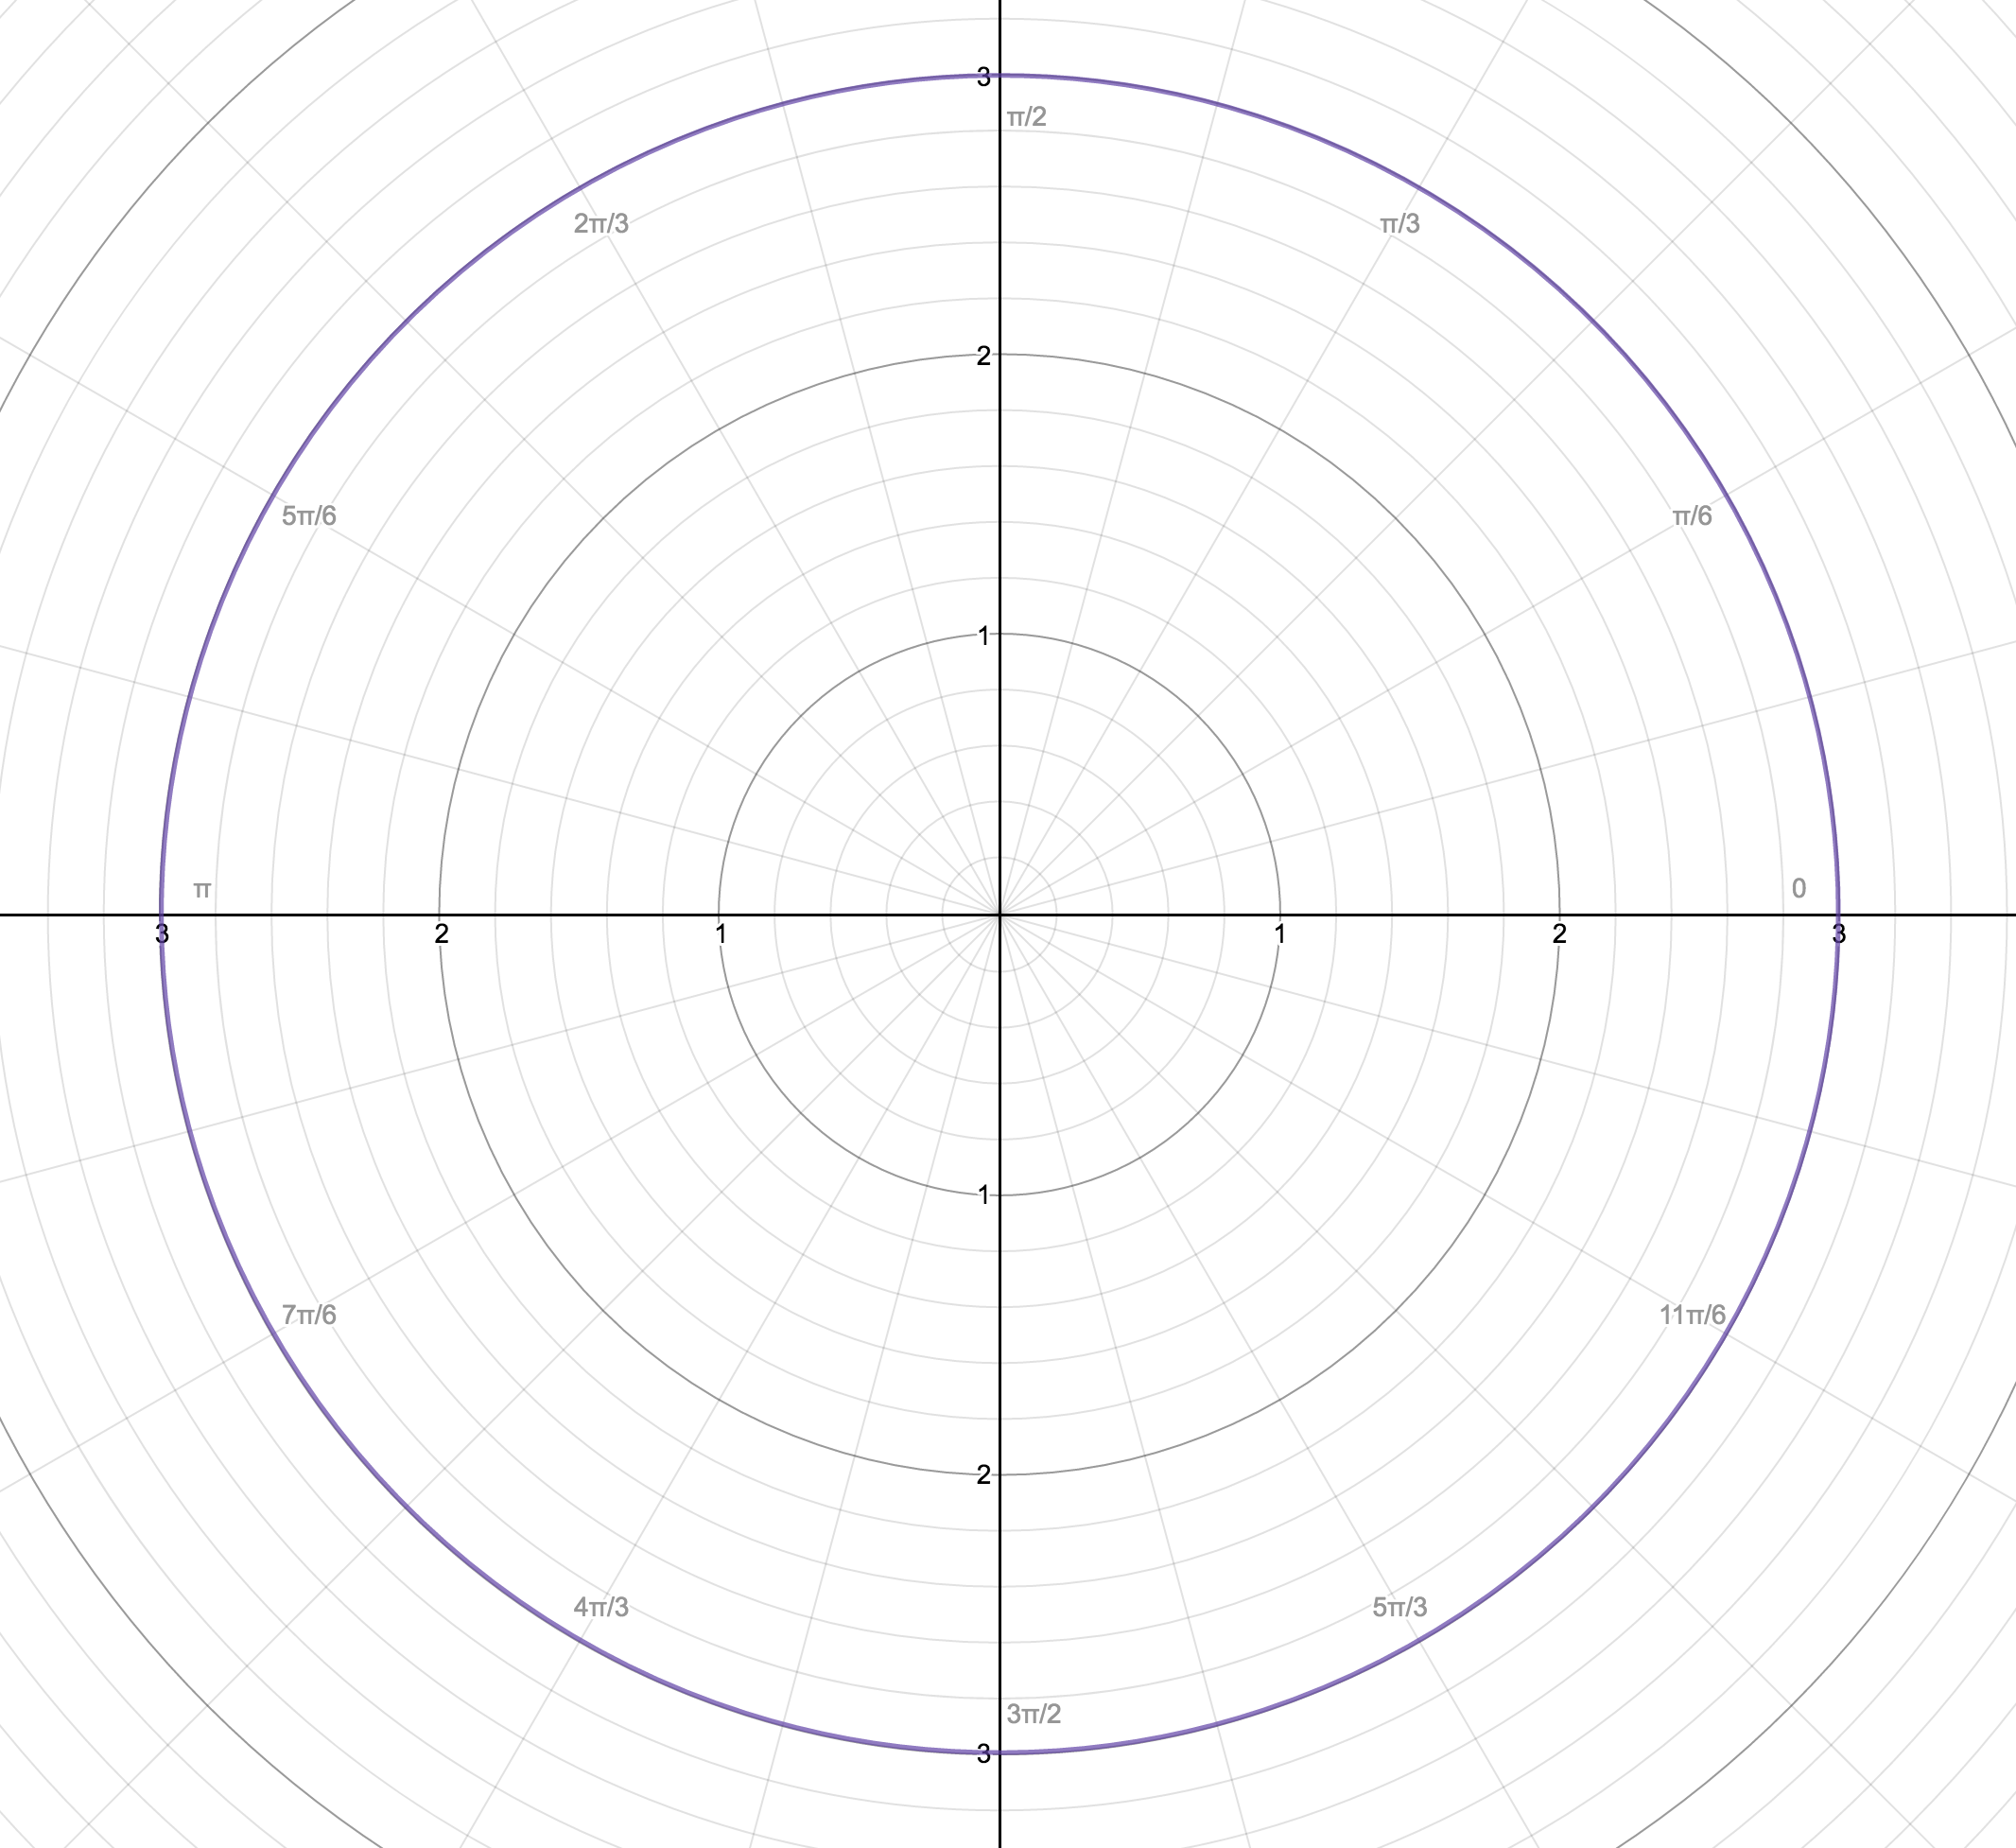
This is one of the simplest graphs to show how a polar equation works on a polar plane.
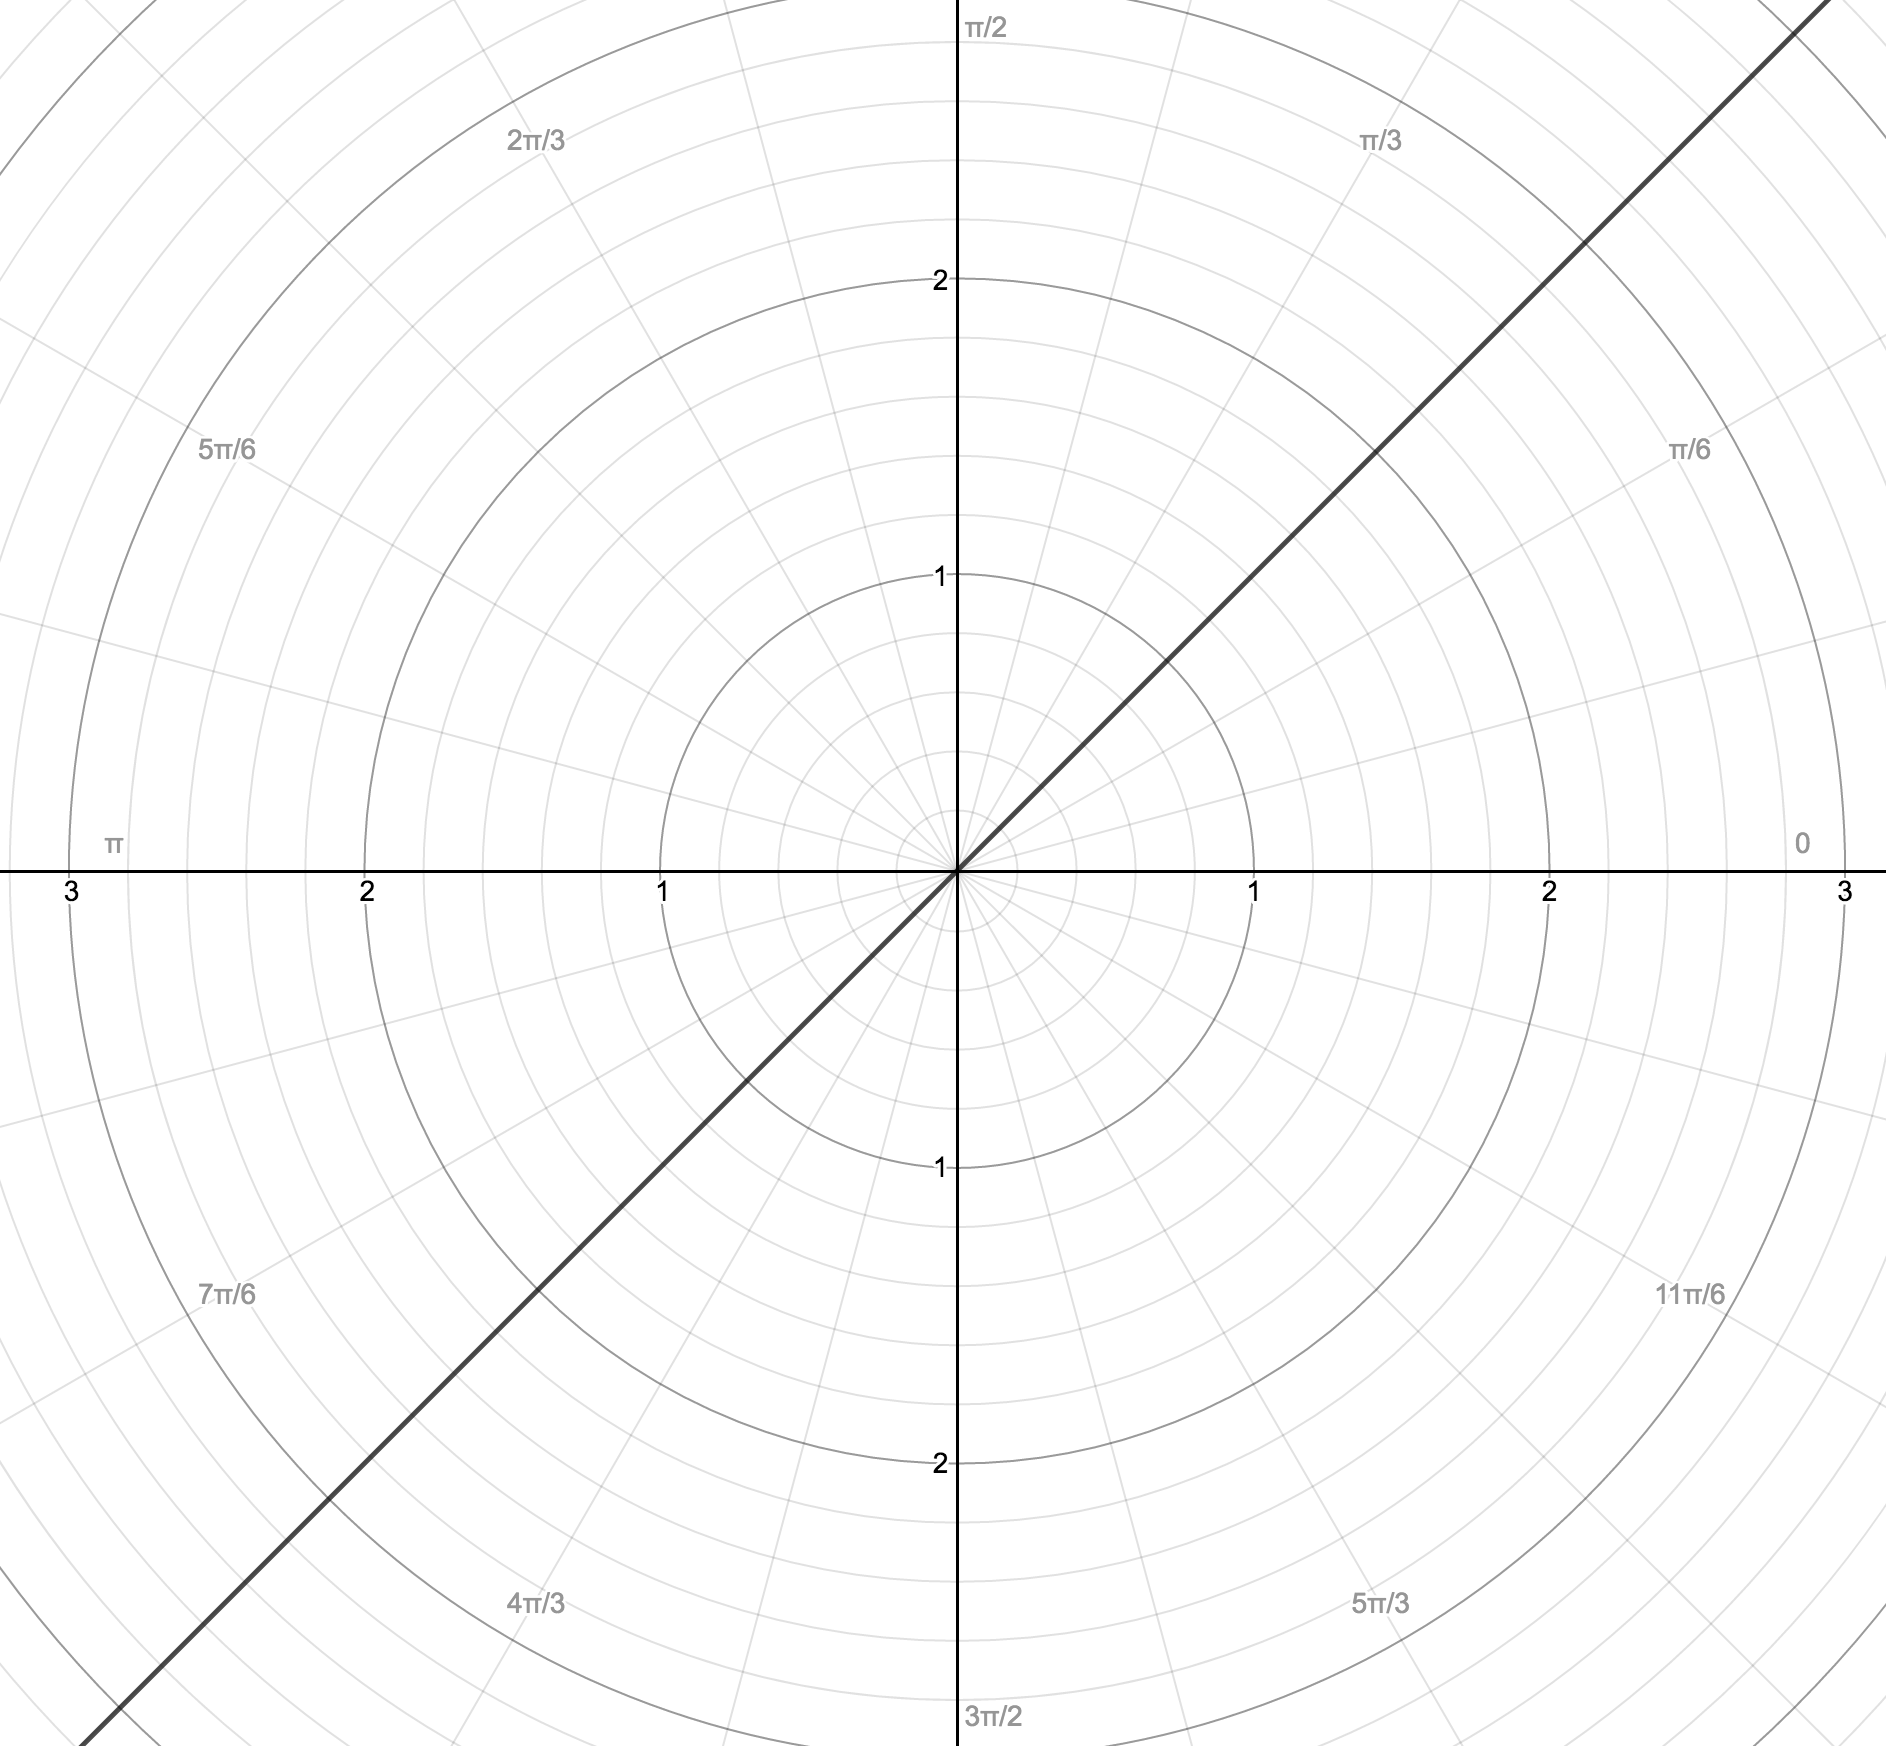
To create a line through the pole you can do this with the following function.
Graph of $y=x$ line using polar graph: $r=\beta$ where $\beta$ is just some constant.
To create a vertical line you can use the $cos(\theta)$ function as a fraction ratio.
Vertical Line: $r=\frac{2}{cos(\theta)} $
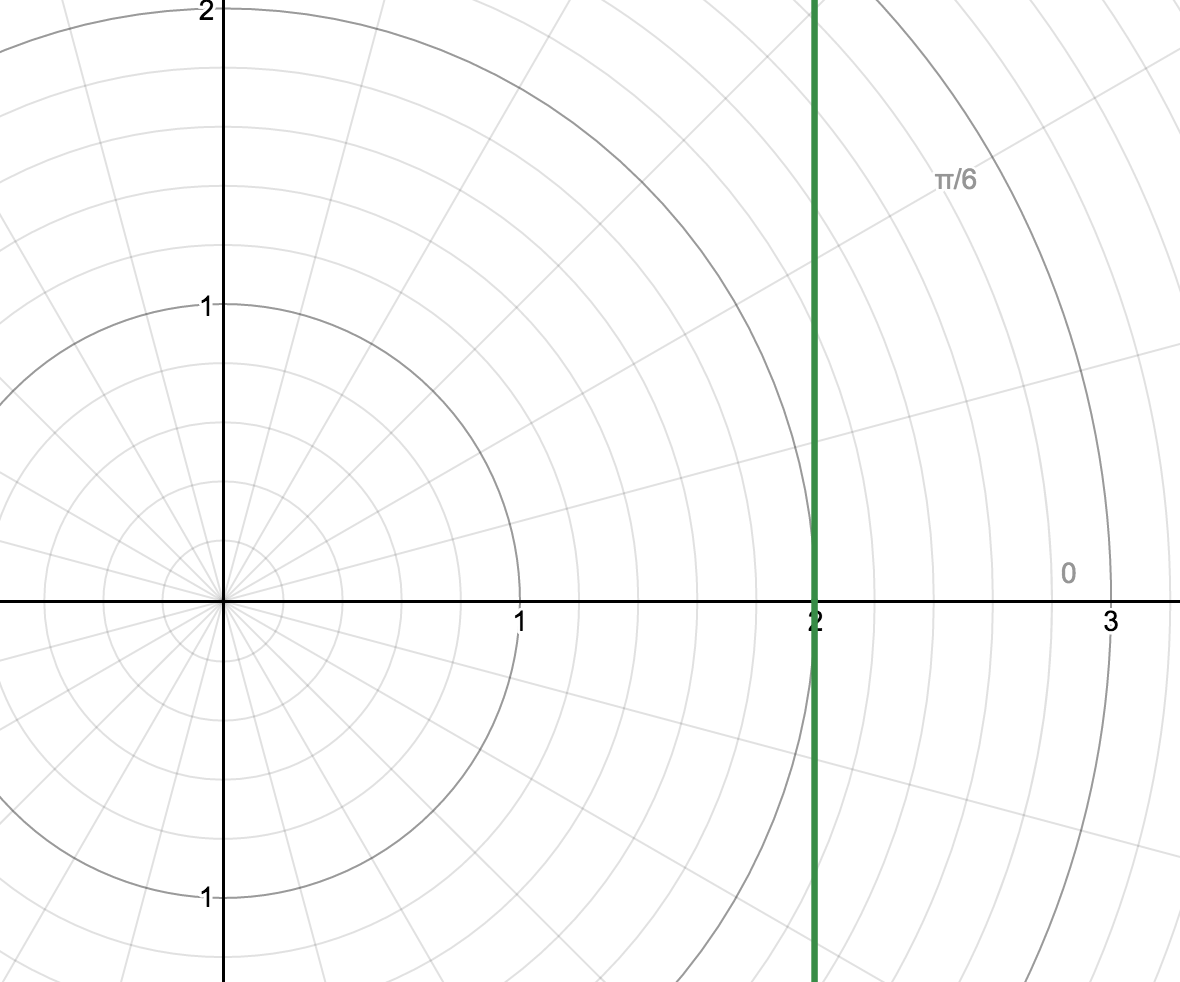
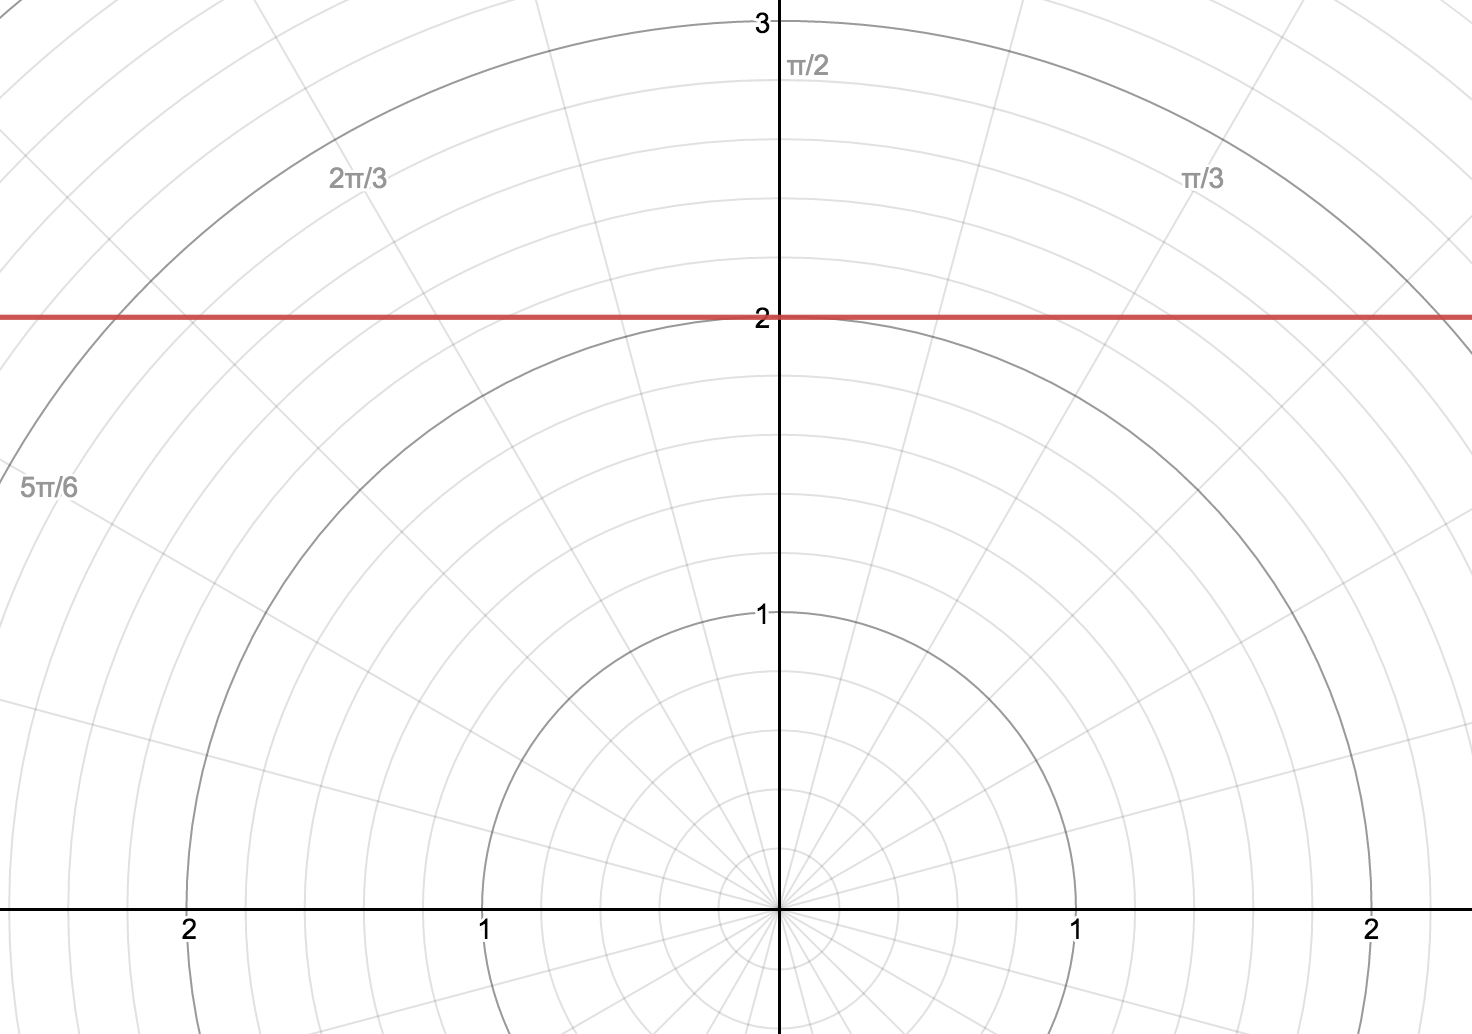
Horizontal Line: $r=\frac{2}{sin(\theta)} $
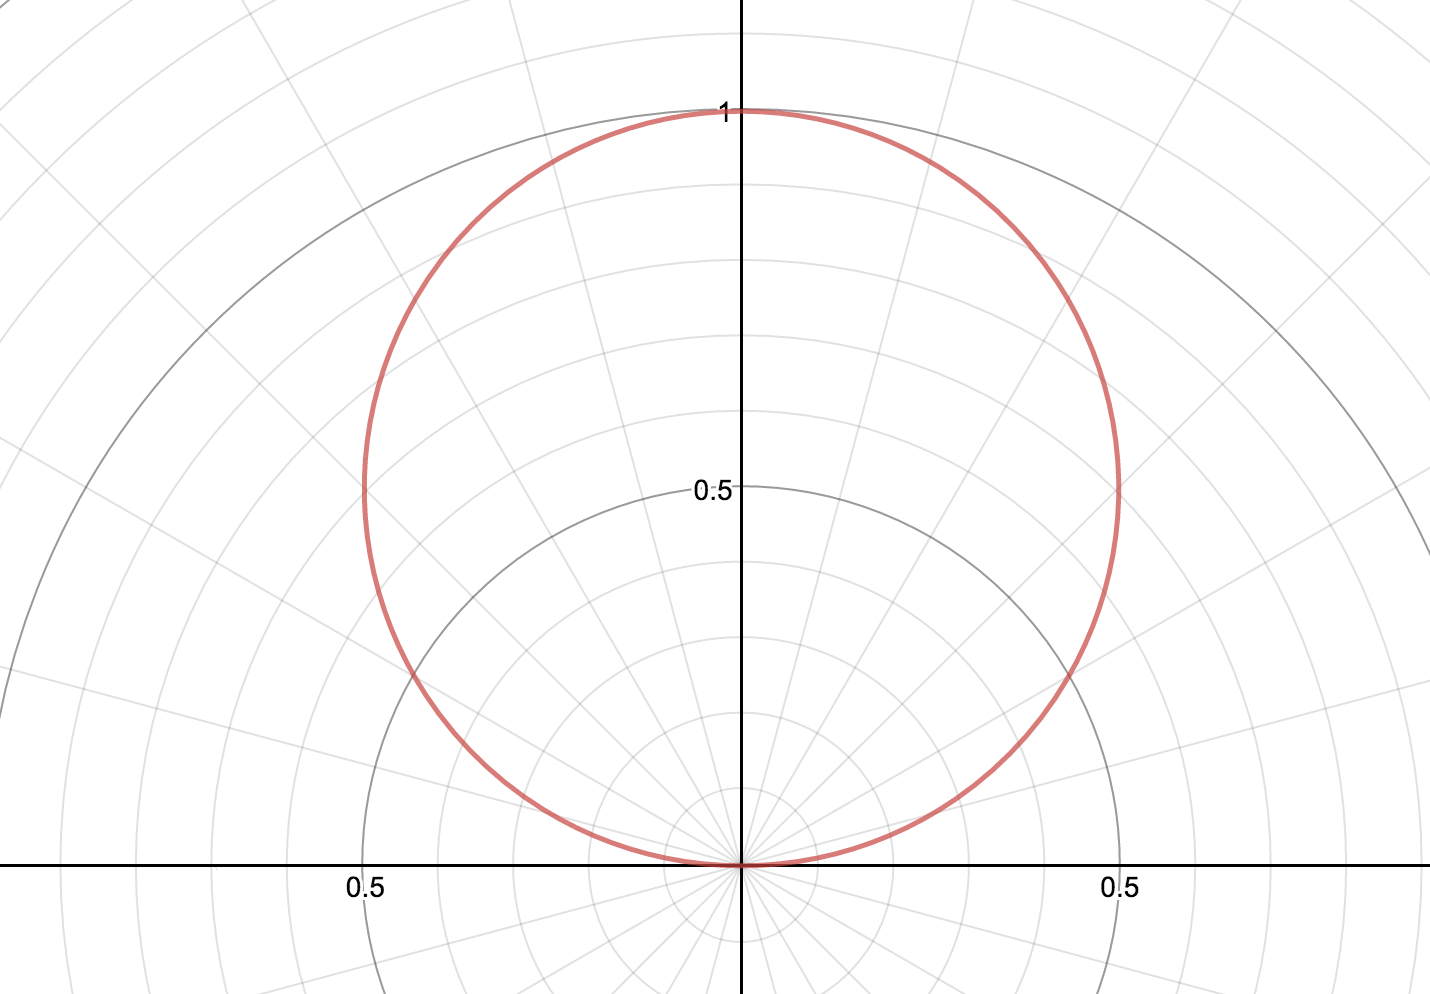
The next graph that's common is the trigonometric functions that you are used to working with. The following are the cos(x) and sin(x).
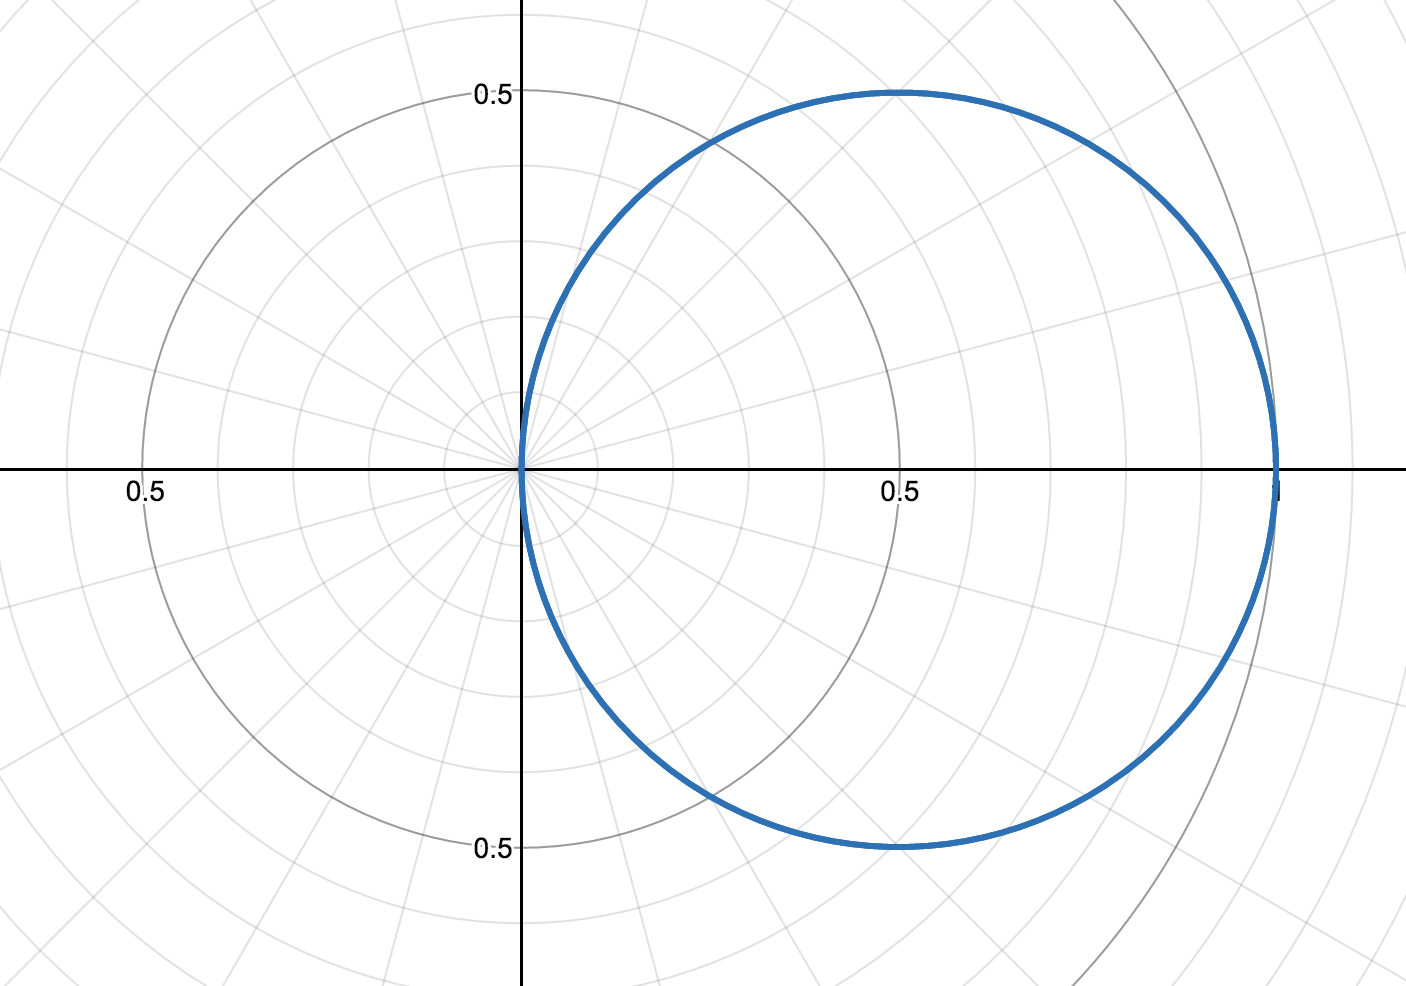
Cosine Graph: $r=cos(\theta)$
Sine Graph: $r=sin(\theta)$