How do you plot values of a function on a graph?
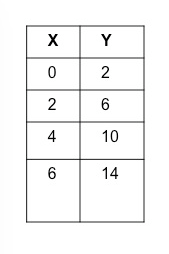
It's easy just create a table value pair by entering x values into the function and magically you will get y values back from the function.
It's easy just create a table value pair by entering x values into the function and magically you will get y values back from the function.